Dashboard
The Dashboard page is a high-level graphical representation of the payment transactions happening on your website. It provides a visualization of metrics, such as total transactions volume, total transactions amount, revenue, loss, and so on for a selected time period.
The Dashboard helps you actively monitor your acceptance, rejection, review, and chargeback rates.
To view the Dashboard page:
- Log on to Fraud Protection Advanced. The Dashboard page is the default landing page.
The Dashboard displays the results using a set of infographic widgets. The results are displayed for a time period you specify using the Time Filter tool. You can choose to display the results of the past 7, 30, 60, 90, or 180 days. Or, you can specify a time period using the From and To fields.
In any widget, when you hover over the chart, a context box appears showing the details of that particular data point.

The following widgets are displayed showing the results on Dashboard.
- Transaction Trend
- Total Value
- Top Filters by Rejections
- Chargebacks
- Decision of Transaction reviews
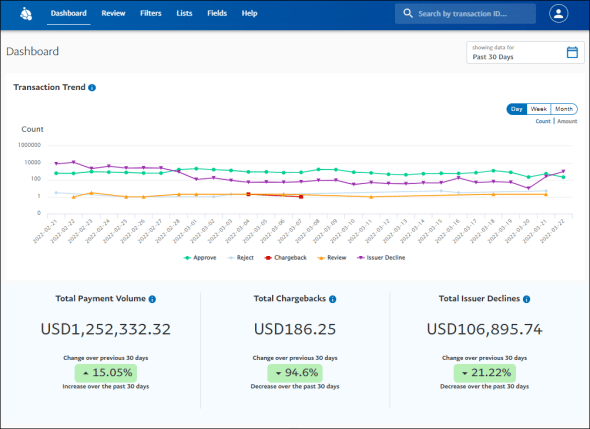
Transaction Trends
The Transaction Trends section displays a line graph that can show the count and the sum of the transactions approved, rejected, placed under review, found to be a chargeback, and declined by issuers. The Count and Amount toggle present in the widget lets you view the count and the sum of transactions respectively.
You can switch the graph view to display the details per day, week, or month using the respective buttons in the widget.
The Approve, Reject, Review, Chargeback, and Issuer Decline buttons in the legend panel at the bottom of the graph let you display or hide the respective lines on the graph.
Total Value
- Total Payment Volume displays the value of the payments approved.
- Total Chargebacks displays the value of the payments found to be a chargeback.
- Total Issuer Declines displays the value of the payments declined by issuers.
Note: The above three widgets also display the growth or decay of these metrics with respect to the past selected period.
Top Filters by Rejections
The Top Filters by Rejections section displays a bar graph that shows the frequency distribution of the top 5 filters approving, rejecting transactions, and placing transactions under review.
Chargebacks
The Chargebacks section displays an area graph that can show the count and the sum of the card payment transactions found chargeback. The Count and Amount toggle in the widget lets you view the count of transactions and the sum of transactions respectively.
You can switch the graph view to display the details per day, week, or month using the respective buttons in the widget.
Decision of Transaction reviews
The Decision of Transaction reviews section displays a bar chart that can show the count and the sum of the transactions approved, rejected through manual reviews. The Count and Amount toggle in the widget lets you view the count of transactions and the sum of transactions respectively.
You can switch the graph view to display the details per day, week, or month using the respective buttons in the widget.
Search Box
You can search for transactions with the Search Box option at the top of the Dashboard page and all other application pages. The application allows you to search for specific transactions using the Transaction ID parameter.